LeakCanary源码解析

LeakCanary : https://github.com/square/leakcanary

version : 1.6.3

Header

LeakCanary 是一款专门用来侦测 Android 内存泄漏的类库。使用方式简单,代码侵入性低,基本上算是 Android 开发必备工具了。

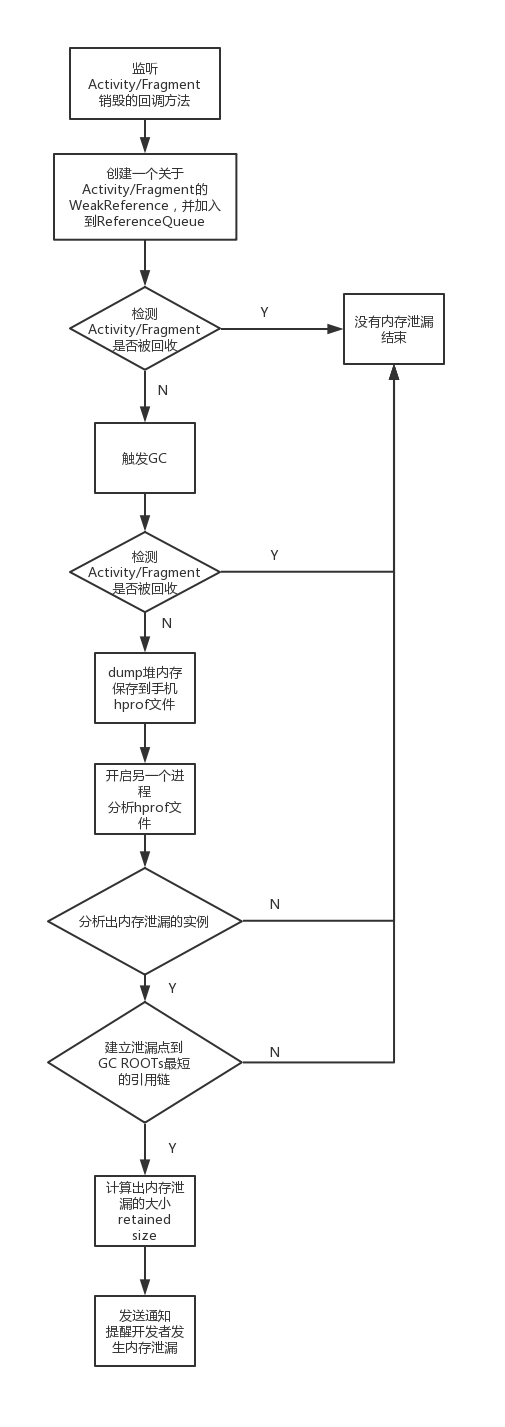
今天就主要来分析一下 LeakCanary 的实现原理。在开头就简单地讲讲它的实现思路:LeakCanary 将检测的对象(一般是 Activity 或 Fragment)放入弱引用中,并且弱引用关联到引用队列中,触发 GC 之后,查看引用队列中是否存在该弱引用,如果发现没有,那么有可能发生内存泄漏了,dump 出堆内存快照进行分析。分析出泄漏实例后再查找到它的引用链,最后发送通知给开发者。

Prepare

这里先简单讲解一下 WeakReference 的知识。

Q: 如何检测一个对象是否被回收?
A: 采用 WeakReference + ReferenceQueue 的方案检测

Reference

Reference 把内存分为 4 种状态,Active 、 Pending 、 Enqueued 、 Inactive。

  • Active :一般说来 Reference 被创建出来分配的状态都是 Active
  • Pending :马上要放入队列(ReferenceQueue)的状态,也就是马上要回收的对象
  • Enqueued :Reference 对象已经进入队列,即 Reference 对象已经被回收
  • Inactive :Reference 从队列中取出后的最终状态,无法变成其他的状态。

ReferenceQueue

引用队列,在 Reference 被回收的时候,Reference 会被添加到 ReferenceQueue 中。
作用:用来检测 Reference 是否被回收。

代码解释

下面这段代码来自于 「Leakcanary 源码分析」看这一篇就够了

1
2
3
4
5
6
7
8
9
10
11
12
13
14
15
16
//创建一个引用队列  
ReferenceQueue queue = new ReferenceQueue();

// 创建弱引用,此时状态为Active,并且Reference.pending为空,
// 当前Reference.queue = 上面创建的queue,并且next=null
// reference 创建并关联 queue
WeakReference reference = new WeakReference(new Object(), queue);

// 当GC执行后,由于是弱引用,所以回收该object对象,并且置于pending上,此时reference的状态为PENDING
System.gc();

// ReferenceHandler从 pending 中取下该元素,并且将该元素放入到queue中,
//此时Reference状态为ENQUEUED,Reference.queue = Reference.ENQUEUED

// 当从queue里面取出该元素,则变为INACTIVE,Reference.queue = Reference.NULL
Reference reference1 = queue.remove();

在 Reference 类加载的时候,Java 虚拟机会会创建一个最大优先级的后台线程,这个线程的工作就是不断检测 pending 是否为 null,如果不为 null,那么就将它放到 ReferenceQueue。因为 pending 不为 null,就说明引用所指向的对象已经被 GC,变成了不也达。

源码解析

LeakCanary 初始化的代码就一句 LeakCanary.install(application) 。所以我们就从入口开始看吧。

LeakCanary.install

1
2
3
4
5
6
7
8
9
public static @NonNull RefWatcher install(@NonNull Application application) {
return refWatcher(application).listenerServiceClass(DisplayLeakService.class)
.excludedRefs(AndroidExcludedRefs.createAppDefaults().build())
.buildAndInstall();
}

public static @NonNull AndroidRefWatcherBuilder refWatcher(@NonNull Context context) {
return new AndroidRefWatcherBuilder(context);
}

在 install 方法中,使用了构造者模式来创建 RefWatcher 。我们直接看 AndroidRefWatcherBuilder 的 buildAndInstall 模式。

AndroidRefWatcherBuilder.buildAndInstall

1
2
3
4
5
6
7
8
9
10
11
12
13
14
15
16
17
18
19
20
21
22
public @NonNull RefWatcher buildAndInstall() {
if (LeakCanaryInternals.installedRefWatcher != null) {
throw new UnsupportedOperationException("buildAndInstall() should only be called once.");
}
// 创建出 RefWatcher
RefWatcher refWatcher = build();
if (refWatcher != DISABLED) {
if (enableDisplayLeakActivity) {
LeakCanaryInternals.setEnabledAsync(context, DisplayLeakActivity.class, true);
}
// 侦测 Activity
if (watchActivities) {
ActivityRefWatcher.install(context, refWatcher);
}
// 侦测 Fragment
if (watchFragments) {
FragmentRefWatcher.Helper.install(context, refWatcher);
}
}
LeakCanaryInternals.installedRefWatcher = refWatcher;
return refWatcher;
}

重点来看 ActivityRefWatcher.install(context, refWatcher); 在这里我们就只看 ActivityRefWatcher 了,因为 FragmentRefWatcher 的原理也是差不多。

AndroidRefWatcher.install

1
2
3
4
5
6
7
8
9
10
11
12
13
public static void install(@NonNull Context context, @NonNull RefWatcher refWatcher) {
Application application = (Application) context.getApplicationContext();
ActivityRefWatcher activityRefWatcher = new ActivityRefWatcher(application, refWatcher);

application.registerActivityLifecycleCallbacks(activityRefWatcher.lifecycleCallbacks);
}

private final Application.ActivityLifecycleCallbacks lifecycleCallbacks =
new ActivityLifecycleCallbacksAdapter() {
@Override public void onActivityDestroyed(Activity activity) {
refWatcher.watch(activity);
}
};

在 AndroidRefWatcher 中,只是去注册了 ActivityLifecycleCallbacks 接口。在 onActivityDestroyed 方法中调用 refWatcher 去观察该 Activity 有没有内存泄漏。这样,就不需要开发者手动地去写代码监听每一个 Activity 了。

RefWatcher.watch

1
2
3
4
5
6
7
8
9
10
11
12
13
14
15
16
17
18
19
20
21
22
23
24
25
26
27
28
29
30
31
public void watch(Object watchedReference) {
watch(watchedReference, "");
}

public void watch(Object watchedReference, String referenceName) {
if (this == DISABLED) {
return;
}
checkNotNull(watchedReference, "watchedReference");
checkNotNull(referenceName, "referenceName");
final long watchStartNanoTime = System.nanoTime();
// 创建出唯一的 key ,用来标示该 WeakReference
String key = UUID.randomUUID().toString();
// 把该 key 加入到 Set 集合中
retainedKeys.add(key);
// 创建弱引用,把 activity 传入
final KeyedWeakReference reference =
new KeyedWeakReference(watchedReference, key, referenceName, queue);
// 观察该 Activity 有没有被GC回收
ensureGoneAsync(watchStartNanoTime, reference);
}

private void ensureGoneAsync(final long watchStartNanoTime, final KeyedWeakReference reference) {
// 这里会调用 IdleHandler 等待主线程空闲的时候再执行
watchExecutor.execute(new Retryable() {
@Override public Retryable.Result run() {
// 确认 Activity 有没有被回收
return ensureGone(reference, watchStartNanoTime);
}
});
}

创建出一个有唯一标示的 WeakReference ,然后调用 ensureGone 来看看 Activity 有没有被回收。

RefWatcher.ensureGone

1
2
3
4
5
6
7
8
9
10
11
12
13
14
15
16
17
18
19
20
21
22
23
24
25
26
27
28
29
30
31
32
33
34
35
36
37
38
39
40
41
42
43
44
45
46
47
48
49
50
51
52
53
54
55
56
@SuppressWarnings("ReferenceEquality") // Explicitly checking for named null.
Retryable.Result ensureGone(final KeyedWeakReference reference, final long watchStartNanoTime) {
long gcStartNanoTime = System.nanoTime();
long watchDurationMs = NANOSECONDS.toMillis(gcStartNanoTime - watchStartNanoTime);
//把 referenceQueue 中已经入列的弱引用取出
//然后从 set 集合中把对应的 retainedKeys 移除
removeWeaklyReachableReferences();

if (debuggerControl.isDebuggerAttached()) {
// The debugger can create false leaks.
return RETRY;
}
// 如果 set 中没有对应的key ,那就说明没有内存泄漏
if (gone(reference)) {
return DONE;
}
// 触发 GC
gcTrigger.runGc();
// 再检查一遍
removeWeaklyReachableReferences();
// 如果在 set 中还有这个key,说明内存泄漏了
if (!gone(reference)) {
long startDumpHeap = System.nanoTime();
long gcDurationMs = NANOSECONDS.toMillis(startDumpHeap - gcStartNanoTime);
// 调用 Debug.dumpHprofData dump出内存快照
File heapDumpFile = heapDumper.dumpHeap();
if (heapDumpFile == RETRY_LATER) {
// Could not dump the heap.
return RETRY;
}
long heapDumpDurationMs = NANOSECONDS.toMillis(System.nanoTime() - startDumpHeap);

HeapDump heapDump = heapDumpBuilder.heapDumpFile(heapDumpFile).referenceKey(reference.key)
.referenceName(reference.name)
.watchDurationMs(watchDurationMs)
.gcDurationMs(gcDurationMs)
.heapDumpDurationMs(heapDumpDurationMs)
.build();
// 分析内存, 这里的 heapdumpListener 实现类是 ServiceHeapDumpListener
heapdumpListener.analyze(heapDump);
}
return DONE;
}

private boolean gone(KeyedWeakReference reference) {
return !retainedKeys.contains(reference.key);
}

private void removeWeaklyReachableReferences() {
// WeakReferences are enqueued as soon as the object to which they point to becomes weakly
// reachable. This is before finalization or garbage collection has actually happened.
KeyedWeakReference ref;
while ((ref = (KeyedWeakReference) queue.poll()) != null) {
retainedKeys.remove(ref.key);
}
}

ensureGone 中逻辑就是反复地确认 Set 集合中还有没有 key ,如果没有的话就代表没有内存泄漏;反之,就很有可能发生了内存泄漏。

ServiceHeapDumpListener.analyze

1
2
3
4
5
6
7
8
9
10
11
12
13
14
15
16
17
public final class ServiceHeapDumpListener implements HeapDump.Listener {

private final Context context;
private final Class<? extends AbstractAnalysisResultService> listenerServiceClass;

public ServiceHeapDumpListener(@NonNull final Context context,
@NonNull final Class<? extends AbstractAnalysisResultService> listenerServiceClass)
{

this.listenerServiceClass = checkNotNull(listenerServiceClass, "listenerServiceClass");
this.context = checkNotNull(context, "context").getApplicationContext();
}

@Override public void analyze(@NonNull HeapDump heapDump) {
checkNotNull(heapDump, "heapDump");
// HeapAnalyzerService 将运行在另外一个独立的进程中
HeapAnalyzerService.runAnalysis(context, heapDump, listenerServiceClass);
}
}

ServiceHeapDumpListener 这里主要调用了 HeapAnalyzerService 来分析内存。注意,HeapAnalyzerService 是运行在另外一个进程中的,不是主进程。

HeapAnalyzerService.runAnalysis

1
2
3
4
5
6
7
8
9
public static void runAnalysis(Context context, HeapDump heapDump,
Class<? extends AbstractAnalysisResultService> listenerServiceClass)
{

setEnabledBlocking(context, HeapAnalyzerService.class, true);
setEnabledBlocking(context, listenerServiceClass, true);
Intent intent = new Intent(context, HeapAnalyzerService.class);
intent.putExtra(LISTENER_CLASS_EXTRA, listenerServiceClass.getName());
intent.putExtra(HEAPDUMP_EXTRA, heapDump);
ContextCompat.startForegroundService(context, intent);
}

HeapAnalyzerService 其实是继承了 IntentService 的。所以只要看 onHandleIntent 中的内容就好了,对应着也就是 onHandleIntentInForeground 方法。

HeapAnalyzerService.onHandleIntentInForeground

1
2
3
4
5
6
7
8
9
10
11
12
13
14
15
16
@Override protected void onHandleIntentInForeground(@Nullable Intent intent) {
if (intent == null) {
CanaryLog.d("HeapAnalyzerService received a null intent, ignoring.");
return;
}
String listenerClassName = intent.getStringExtra(LISTENER_CLASS_EXTRA);
HeapDump heapDump = (HeapDump) intent.getSerializableExtra(HEAPDUMP_EXTRA);

HeapAnalyzer heapAnalyzer =
new HeapAnalyzer(heapDump.excludedRefs, this, heapDump.reachabilityInspectorClasses);
// 分析内存,查找内存泄漏点以及引用链
AnalysisResult result = heapAnalyzer.checkForLeak(heapDump.heapDumpFile, heapDump.referenceKey,
heapDump.computeRetainedHeapSize);
// 找到后,发送通知给开发者
AbstractAnalysisResultService.sendResultToListener(this, listenerClassName, heapDump, result);
}

分析内存的步骤主要在 HeapAnalyzer 中。

HeapAnalyzer.checkForLeak

1
2
3
4
5
6
7
8
9
10
11
12
13
14
15
16
17
18
19
20
21
22
23
24
25
26
27
28
29
30
31
32
33
34
public @NonNull AnalysisResult checkForLeak(@NonNull File heapDumpFile,
@NonNull String referenceKey,
boolean computeRetainedSize)
{

long analysisStartNanoTime = System.nanoTime();

if (!heapDumpFile.exists()) {
Exception exception = new IllegalArgumentException("File does not exist: " + heapDumpFile);
return failure(exception, since(analysisStartNanoTime));
}

try {
listener.onProgressUpdate(READING_HEAP_DUMP_FILE);
HprofBuffer buffer = new MemoryMappedFileBuffer(heapDumpFile);
HprofParser parser = new HprofParser(buffer);
listener.onProgressUpdate(PARSING_HEAP_DUMP);
Snapshot snapshot = parser.parse();
listener.onProgressUpdate(DEDUPLICATING_GC_ROOTS);
deduplicateGcRoots(snapshot);
listener.onProgressUpdate(FINDING_LEAKING_REF);
// 发现内存泄漏的实例
Instance leakingRef = findLeakingReference(referenceKey, snapshot);

// False alarm, weak reference was cleared in between key check and heap dump.
// 如果实例不存在,那就说明没有内存泄漏
if (leakingRef == null) {
String className = leakingRef.getClassObj().getClassName();
return noLeak(className, since(analysisStartNanoTime));
}
// 分析出对应的引用链
return findLeakTrace(analysisStartNanoTime, snapshot, leakingRef, computeRetainedSize);
} catch (Throwable e) {
return failure(e, since(analysisStartNanoTime));
}
}

这里主要有两个方法的看点:

  • findLeakingReference
  • findLeakTrace

我们先来看第一个 findLeakingReference 。

HeapAnalyzer.findLeakingReference

1
2
3
4
5
6
7
8
9
10
11
12
13
14
15
16
17
18
19
20
21
22
23
private Instance findLeakingReference(String key, Snapshot snapshot) {
ClassObj refClass = snapshot.findClass(KeyedWeakReference.class.getName());
if (refClass == null) {
throw new IllegalStateException(
"Could not find the " + KeyedWeakReference.class.getName() + " class in the heap dump.");
}
List<String> keysFound = new ArrayList<>();
for (Instance instance : refClass.getInstancesList()) {
List<ClassInstance.FieldValue> values = classInstanceValues(instance);
Object keyFieldValue = fieldValue(values, "key");
if (keyFieldValue == null) {
keysFound.add(null);
continue;
}
String keyCandidate = asString(keyFieldValue);
if (keyCandidate.equals(key)) {
return fieldValue(values, "referent");
}
keysFound.add(keyCandidate);
}
throw new IllegalStateException(
"Could not find weak reference with key " + key + " in " + keysFound);
}

还记得之前 KeyedWeakReference 中的那个唯一标示 key 吗?对,这里找内存泄漏的实例也是靠它。

通过那个 key 可以找出 KeyedWeakReference 实例,然后 KeyedWeakReference 实例中 referent 全局变量就是我们要找的内存泄漏实例。也就是我们的 Activity/Fragment 对象。

这样,就完成了内存泄漏的实例查找。然后我们再来看第二个点 findLeakTrace 方法。

HeapAnalyzer.findLeakTrace

1
2
3
4
5
6
7
8
9
10
11
12
13
14
15
16
17
18
19
20
21
22
23
24
25
26
27
28
29
30
31
32
33
34
35
36
37
38
39
40
private AnalysisResult findLeakTrace(long analysisStartNanoTime, Snapshot snapshot,
Instance leakingRef, boolean computeRetainedSize)
{


listener.onProgressUpdate(FINDING_SHORTEST_PATH);
ShortestPathFinder pathFinder = new ShortestPathFinder(excludedRefs);
ShortestPathFinder.Result result = pathFinder.findPath(snapshot, leakingRef);

String className = leakingRef.getClassObj().getClassName();

// False alarm, no strong reference path to GC Roots.
if (result.leakingNode == null) {
return noLeak(className, since(analysisStartNanoTime));
}

listener.onProgressUpdate(BUILDING_LEAK_TRACE);
LeakTrace leakTrace = buildLeakTrace(result.leakingNode);

long retainedSize;
if (computeRetainedSize) {

listener.onProgressUpdate(COMPUTING_DOMINATORS);
// Side effect: computes retained size.
snapshot.computeDominators();

Instance leakingInstance = result.leakingNode.instance;

retainedSize = leakingInstance.getTotalRetainedSize();

// TODO: check O sources and see what happened to android.graphics.Bitmap.mBuffer
if (SDK_INT <= N_MR1) {
listener.onProgressUpdate(COMPUTING_BITMAP_SIZE);
retainedSize += computeIgnoredBitmapRetainedSize(snapshot, leakingInstance);
}
} else {
retainedSize = AnalysisResult.RETAINED_HEAP_SKIPPED;
}

return leakDetected(result.excludingKnownLeaks, className, leakTrace, retainedSize,
since(analysisStartNanoTime));
}

findLeakTrace 方法总体的逻辑就是

  • 建立内存泄漏点到 GC Roots 的最短引用链
  • 计算整个内存泄漏的大小 retained size

这里的在内存快照中引用链建立等都是在 haha 库中完成的。haha 是 square 出品一款 Android Heap 分析库。

具体可以看这里 :https://github.com/square/haha

到这里,LeakCanary 整体的逻辑分析就讲完了。下面再给出一张流程图。

流程图

LeakCanary流程图

Footer

其实 LeakCanary 整体的代码流程很清晰,阅读起来也比较易懂,也给我们好好地上了一课。

Read the fucking source code!

Reference

俞其荣 wechat
欢迎订阅我的微信公众号来获取我的动态!
坚持原创技术分享,您的支持将鼓励我继续创作!